Posts

Showing posts from July, 2019

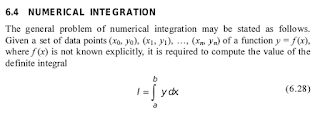
trapezoidal

#numerical integration by trapezoidal rule def f(x):     return 1/(1+x) a=0 b=6 k=a h=1.0 y=[] integral=0.0 while k<=6:     y.append(f(k))     k=k+h integral =integral +y[0]+(y[1]*4)+y[len(y)-1] k=3 while k<=len(y)-2:     integral =integral +y[k]*4+((y[k-1])*2)     k=k+2 integral=(integral*h)/3 print"within in the limits",a,"and",b,"integral of given function" print integral

Spectrometer- Determination of Cauchy's constants

Image
Aim: To determine the Cauchy’s constant of the given prism.    Apparatus: Spectrometer, prism, prism clamp, Magnifying glass, mercury vapor lamp, etc. Theory: Cauchy's equation is an empirical relationship between the refractive index and wavelength of light for a particular transparent material. It is named for the mathematician Augustin-Louis Cauchy, who defined it in 1836.    The most general form of Cauchy's equation is    . . . . .. . . (1) where n is the refractive index, λ is the wavelength, B, C, D, etc., are coefficients that can be determined for a material by fitting the equation to measured refractive indices at known wavelengths. The refractive index n of the material of the prism for a wavelength λ is given by.                                . . . . ..  .. ..(2)  Where A and B are called Cauchy’s constants for the prism. If the refractive indices n1 and n2 for any two known wavelength λ1 and λ2 are determined by

Cornus Experiment

Image
AIM: To find the elastic constants of the Perspex beam using Cornus interference method. 1. Young’s modulus(Y) 2. Poisons ratio (σ) 3. Bulk modulus (b) APPARATUS Sodium vapor lamp, transparent beam, convex lens, travelling microscope, two knife edges, a set of weights, weight holders and a mirror. EXPERIMENTAL SET UP  Consider a rectangular Perspex beam of length 'L',breadth 'a' and thickness 'b'.A Plano convex lens is placed over the beam. Weight hanger is placed at both ends in which mass can be added. Knife edges were placed at a distance ‘l’ from both weight hangers. A light source is used to illuminate the arrangement.  THEORY   An air film is obtained between convex lens and Perspex beam. The light is made to fall normally on the air film with the help of a glass plate on the arrangement. The interference fringes formed is viewed by means of travelling microscope. Without adding any mass in the weight hang

Viscosity Oscillating Disc

Image

Koenings Method

Image

MSc S2 Computaional Syllabus

Image

RK 4 order method & RK 2 order

Image
RK Fourth Order: #Given dy / dx = y − x where y (0) = 2, find y (0.1) def f(x,y):     return y-x x,y,n=input('Enter initial values of x,y and no. of intervals: ') xf=input('Enter x for which y is required: ') h=(xf-x)/float(n) for i in range(n):     k1=h*f(x,y)     k2=h*f(x+h/2,y+k1/2)     k3=h*f(x+h/2,y+k2/2)     k4=h*f(x+h,y+k3)     x=x+h y=y+(k1+2*(k2+k3)+k4)/6.0 print 'The values of y at %f=%f' %(x,y) Output: Enter initial values of x,y and no. of intervals: 0,2,1 Enter x for which y is required: .1 The values of y at 0.100000=2.205171 RK Second Order: def f(x,y):     return y-x x,y,n=input('Enter initial values of x,y and no. of intervals: ') xf=input('Enter x for which y is required: ') h=(xf-x)/float(n) for i in range(n):     k1=h*f(x,y)     k2=h*f(x+h/2,y+k1/2)     x=x+h y=y+(k1+k2)/2.0 print 'The values of y at %f=%f' %(x,y) Output: Enter initial values of x,y and no. of intervals: 0,2,1 E

Numerical Integration

Image
#Trapezoidal def f(x):     return 1/(1+x) a,b,n=input('Input lower limit(a), upper limit(b) & no. of steps(n): ') h=(b-a)/float(n) x=[a+h*i for i in range(n+1)] y=[f(x[i]) for i in range(n+1)] trapint=(h/2.0)*(y[0]+ y[-1]+ 2*sum(y[1:-1:1])) print 'Integral using trapezoidal method= ',trapint Output: Input lower limit(a), upper limit(b) & no. of steps(n): 0,1,4 Integral using trapezoidal method=  0.697023809524 #Simpsons: def f(x):     return 1/(1+x) a,b,n=input('Input lower limit(a), upper limit(b) & no. of steps(even no.)(n): ') h=(b-a)/float(n) x=[a+h*i for i in range(n+1)] y=[f(x[i]) for i in range(n+1)] simpint=(h/3.0)*(y[0]+y[-1]+4*sum(y[1:-1:2])+2*sum(y[2:-1:2])) print 'Integral using Simpson\'s 1/3 rule= ', simpint Output: Input lower limit(a), upper limit(b) & no. of steps(even no.)(n): 0,1,4 Integral using Simpson's 1/3 rule=  0.693253968254

Least Square Fit

Image
from pylab import* print 'enter number of data points' n=int(input()) sumx=0 sumy=0 sumxx=0 sumxy=0 xpoints=[] ypoints=[] newy=[] print 'enter x,y data points one by one' for i in range (1,n+1):     x,y=input()     xpoints.append(x)     ypoints.append(y)     sumx=sumx+x     sumy=sumy+y     xx=x*x     sumxx=sumxx+xx     xy=x*y     sumxy=sumxy+xy denom=n*sumxx-sumx*sumx a=(n*sumxy-sumx*sumy)/float(denom) b=(sumxx*sumy-sumx*sumxy)/float(denom) print "the pair of points are" for i in range(0,len(xpoints)):     print xpoints[i],ypoints[i]     newyvalue=a*xpoints[i]+b     newy.append(newyvalue) print"the required straight line is y=",a,"x+",b plot (xpoints,ypoints,'o') plot(xpoints,newy,'r') show() Output: enter number of data points 5 enter x,y data points one by one 0,1 1,5 2,10 3,22 4,38 the pair of points are 0 1 1 5 2 10 3 22 4 38 the required straight line is y= 9.1 x+ -3.0

Lagrange interpolation

Image
#Lagrange interpolation n=input(" No of data points = ") xd=[] yd=[] print "Enter data points" for i in range(n):     xi,yi=input()     xd.append(xi)     yd.append(yi) x=input(" Enter the x value for which y is to be found ") l=0 for i in range(n):     lg=1     for j in range(n):         if i!= j:             lg=lg*(x-xd[j])/float(xd[i]-xd[j])                l=l+yd[i]*lg    print " Y value = ",l Output No of data points = 4 Enter data points -2,5 1,7 3,11 7,34  Enter the x value for which y is to be found 0  Y value =  6.03888888889 note:1087/180=6.038888889

Solution of Differential Equations

Image
python code: #solve by Euler method:  dy/dx=-y, given y(0)=1 def f(x,y):     return -y h=0.01 y=1.0 x=0 while x<.04:     y=y+h*f(x,y)     x=x+h     print x,"  ",y Output RK Method Second order #to evaluate the differential equ dy/dx=y-x at x=0.1 to x=1.1,y(0)=2 def f(x,y):     return y-x h=0.1 y=2.0 x=0.0 k1=0.0 k2=0.0 while x<0.4:     k1=h*f(x,y)     k2=h*f(x+h,y+k1)     y=y+(k1+k2)/2.0     x=x+h     print x,"    ",y   Output  0.1     2.205 0.2     2.421025 0.3     2.649232625 0.4     2.89090205063 RK method Fourth Order: #to evaluate the differential equ dy/dx=y-x at x=0.1 & x=.2 def f(x,y):     return y-x x,y,h=0.0,2.0,.1 while x<0.2:         k1=h*f(x,y)         k2=h*f(x+h/2,y+k1/2)         k3=h*f(x+h/2,y+k2/2)         k4=h*f(x+h,y+k3)         x=x+h         y=y+(k1+2*(k2+k3)+k4)/6.0         print "k1,k2,k3,k4=",k1,k2,k3,k4         print 'The value of y at %f=%f'%(x,y) Output: k1,k2,k3,k4= 0.2

DFT

Image
#Discrete Fourier Transform from pylab import * def dft(h):     N=len(h)     w=2*pi/N     H=[]     for n in xrange(N):         s=0         for k in xrange(N):             s+=h[k]*exp(w*k*n*1j)         H.append(s)     return H hk=[1,2,3,4] print dft(hk) Output Screen [(10+0j), (-2.0000000000000004-1.9999999999999996j), (-2+9.7971743931788257e-16j), (-1.9999999999999982+2.0000000000000009j)]   

Logistic map

Image
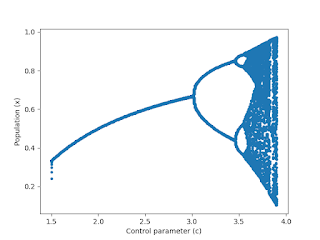
#Logistic map function-Bifurcation Diagram from pylab import * def f(x):     return c*x*(1-x) c,cf=2,3.9  #2 is initail value of control para, 3.9 final vlaue x=.2 xpt=[] ypt=[] while(c<=cf):     for i in range(100):         xpt.append(c)         ypt.append(f(x))         x=f(x)     c=c+.01 plot(xpt,ypt,'.') xlabel('Control parameter (c)') ylabel('Population (x)') show() Output  #Logistic map from pylab import * def f(c,x):     return c*x*(1-x) ci,cf,n,g,x0=2,3.9,100,100,.2 cs=(cf-ci)/1000.0 lx,lc=[],[] for c in arange(ci,cf,cs):     x=x0     for i in range(g):         x=f(c,x)     p=0     while p<n:         x=f(c,x)         lc.append(c)         lx.append(x)         p+=1 print lx print lc xlabel('Control parameter') ylabel('Population') plot(lc,lx,'.') show() Output   Theory : #yn+1=c*yn(1-yn) from pylab import* c=float(input('input control parameter')) i=1 y=.2 while i<73:     y=c*y*(1-y)    

Particle in a box using Schrodinger Equation

Image
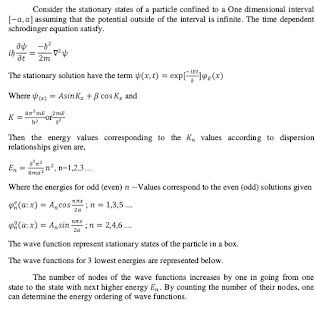
#PARTICLE  INSIDE A BOX using RK method from pylab import* def f1(x,y,z):     return(z) def f2(x,y,z):     return(y) v=0  #potential inside well m=1  #mass y0=0 z0=1 hbar=1 n=int(input('enter the quantum no(n):')) a=float(input('enter size of box:')) e=pi*pi*n*n*hbar*hbar/(2*m*a*a)  #Energy fn=2*m*(v-e)/(hbar*hbar) h=0.005 x0=0 x=[] yp=[]  y=[] z=[] while x0<=a:     k1=h*f1(x0,y0,z0)     l1=h*f2(x0,y0,z0)*fn     k2=h*f1(x0+h/2,y0+k1/2,z0+l1/2)     l2=h*f2(x0+h/2,y0+k1/2,z0+l1/2)*fn     k3=h*f1(x0+h/2,y0+k2/2,z0+l2/2)     l3=h*f2(x0+h/2,y0+k2/2,z0+l2/2)*fn     k4=h*f1(x0+h,y0+k3,z0+l3)     l4=h*f2(x0+h,y0+k3,z0+l3)*fn     k=(k1+2*k2+2*k3+k4)/6     l=(l1+2*l2+2*l3+l4)/6     x1=x0+h     y1=y0+k     z1=z0+l     x0=x1     y0=y1     z0=z1     psi=y0*y0     x.append(x0)     y.append(y0)     yp.append(psi*10)     z.append(z0) print'energy e=',e title('particle in a box') grid(True) plot(x,y) plot(x,yp) legen

Projectile Motion-Euler Method

Image
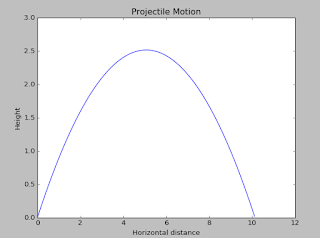
#Projectile Motion-Euler Method from pylab import * g=-9.8 y=input('Height from which projectile is launched: ') v,theta=input('Enter velocity and angle of projection (in degrees): ') theta=radians(theta) vx=v*cos(theta) vy=v*sin(theta) dt=0.01 t=x=0 tdata=[] xdata=[] ydata=[] vdata=[] while y>=0.0:     tdata.append(t)     xdata.append(x)     ydata.append(y)     vdata.append(v)     t=t+dt     x=x+vx*dt     vy=vy+g*dt     y=y+vy*dt     v=hypot(vx,vy) #Printing for (t,x,y,v) in zip(tdata,xdata,ydata,vdata):     print '\t%10.3f\t\t%10.3f\t\t%10.3f\t\t%10.3f'%(t,x,y,v) #Plotting title('Projectile Motion') xlabel('Horizontal distance') ylabel('Height') plot(xdata,ydata) show() #for damped case, vx=vx+ax*dt, vy=vy+ay*dt, ax=-d*vx2*v, ay=-d*vy2*v+g Output #Trajectory of projectile with & without air drag from pylab import* g=9.8 h=y1=y2=input('Height from which projected? ') k=input('Air drag factor (k)? ') u,theta

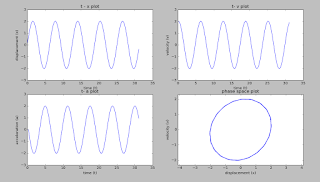
IDEAL SIMPLE HARMONIC OSCILLATOR-EULER METHOD

Image
from pylab import * n=100 x=zeros(n,dtype='float') t=zeros(n,dtype='float') v=zeros(n,dtype='float') a=zeros(n,dtype='float') x[0],v[0],w=0,2,1 dt=10*pi/(w*n) a[0]=-w*w*x[0] for i in range(1,n):     a[i]=-w*w*x[i-1]     v[i]=v[i-1]+a[i]*dt     x[i]=x[i-1]+v[i]*dt     t[i]=t[i-1]+dt subplot(2,2,1) title('t - x plot') xlabel(' time (t)') ylabel('displacement (x)') plot(t,x) subplot(2,2,2) title('t- v plot') xlabel('time (t)') ylabel('velocity (v)') plot(t,v) subplot(2,2,3) title('t- a plot') xlabel('time (t)') ylabel('acceleration (a)') plot(t,a) subplot(2,2,4) axis('equal') title('phase space plot') xlabel('displacement (x)') ylabel('velocity (v)') plot(x,v) show() OUTPUT  

SHO-Feynman Newton Method

Image
#Ideal simple Harmonic Oscillator #Harmonic oscillator #dx/dt=v #dv/dt=-w*w*x #Feynman-Newton method #x(t+h)=x(t)+h*v(t+h/2) #v(t+h/2)=v(t-h/2)+h*a(t) #v(1/2)=v0+(h/2)a0 from pylab import* from math import* x0=5 v0=5 w=1 t=0 #initial time h=0.001 #time step size xdat=[] vdat=[]#velocity data store here time=[]#time stored here v0=v0+h*(-w*w*x0)/2 while(t<=100):     x1=x0+h*v0     v1=v0+h*(-w*w*x1)           xdat.append(x1)     vdat.append(v1)     time.append(t)     x0=x1     v0=v1     t=t+h    figure(1) title("Harmonic oscillator motion") xlabel(" Time") ylabel("x") plot(time,xdat) grid(True) figure(2) title("Harmonic oscillator motion") xlabel("Time") ylabel("Velocity") plot(time,vdat) grid(True) figure(3) title("Harmonic oscillator motion") xlabel("x") ylabel("Velocity") plot(xdat,vdat) grid(True) show() output #DAMPED  HARMONIC OSCILLATOR #dx/dt=v(t) #dv/dt=-w*w*x(t)-c*v(t) #x